SSI Profiler Software
Feature Rich All-In-One Software
SSI Profiler is an All-In-One Program
The SSI Profiler program is integrated into the collection electronics of each SSI profiling system. The software can detect the type of system connected and open features to the user based on their license.
The data collection computer has a perpetual license to SSI Profiler. There are no subscription fees to collect data. Additional licenses for office computers or additional software modules have an annual fee. You never need to pay a fee to collect data.
SSI Profiler is an all-in-one software for data collection, editing, viewing, reporting, and exporting. Data can be rewritten or analyzed under different parameters with a few simple clicks. The software was designed based on SSI experience with field work to optimize the process and reduce training time for new operators.
No matter what SSI system you use to collect the data, the analysis will be within SSI Profiler. This allows for operators of different systems to easily report data from other SSI equipment.
Powerful & User Friendly
Whether you are a new operator or an experienced surveyor, SSI Profiler and our supporting programs can elevate your data to new levels.
- Update software at any time when connected to hardware
- Send feedback directly to SSI staff
- User manual is embedded
- Straight-forward navigation to different datasets and software features
- User licenses can unlock features like:
- Advanced Tools for ROW images, grinding and Transverse Profiles
- Intellicut for efficient corrective grind plans
- Profile Design for milling or paving machine control based on smoothness
- Network Manager to collect and report pavement condition over networks
Explore Our Software
Calibration Overview
SSI Profiler guides the operator through each verification and calibration step-by-step. The program user interface is clear, concise, and easy to understand.
Calibrations and verifications vary depending on system and features, however the SSI Profiler software recognizes the connected system. All calibrations are stored within the data file and can be accessed at any time.
For any system the calibrations and verifications may take operators 10-15 minutes. After the necessary verifications and calibrations are complete, data can be collected.
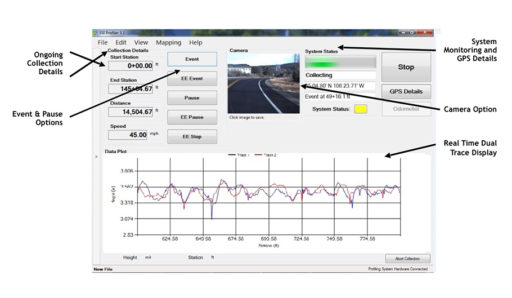
Data Collection
SSI Profiler makes data collection and processing very simple. You don’t need to have expert computer skills to run the SSI software. The operator can use hot keys or known GPS locations to add events or pauses/exclusions. The GPS can be from a known coordinate or from a previous collection. This makes lining up and comparing collections as easy as copy and paste.
- Calibrate and verify system within same window
- Step-by-step instructions
- Software optimized for touchscreen with large buttons
- Onscreen diagnostics for sensors and electronics
- Create user-specific hot keys or set up a collection using GPS Tagging
- Data files are small ~ 0.9 MB/mile for dual laser inertial profiler data
Once data is collected operators can edit the files with infinite iterations. Any section of the collected area can be reported. Editing options include:
- Change start station
- Change station direction
- Change lane number
- Add station equations
- Add or edit pauses/exclusions
- Add or edit point events
- Add buffer exclusions around point events or pauses
- Import other collection files pauses and events
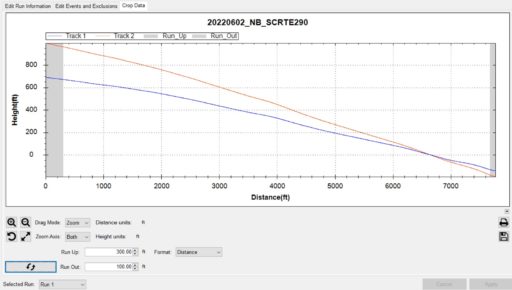
- Crop or trim data
The integrity of the data is preserved because the profile elevations or GPS position assigned to each elevation measurement cannot be edited.
Overview
Once data is collected in SSI Profiler, the same program is used for analysis and reporting. Immediately review, export or print the profiles after saving the data. View IRI results without exporting to ProVAL or report PRI, Boeing Bump and straightedge straight to airfield specifications.
All operators have the ability to use functions for trace view, edit data, Google Maps, export, and report.
Once the data is collected operators can reprocess and edit however they wish. The only thing that cannot be changed are the elevation profiles themselves.
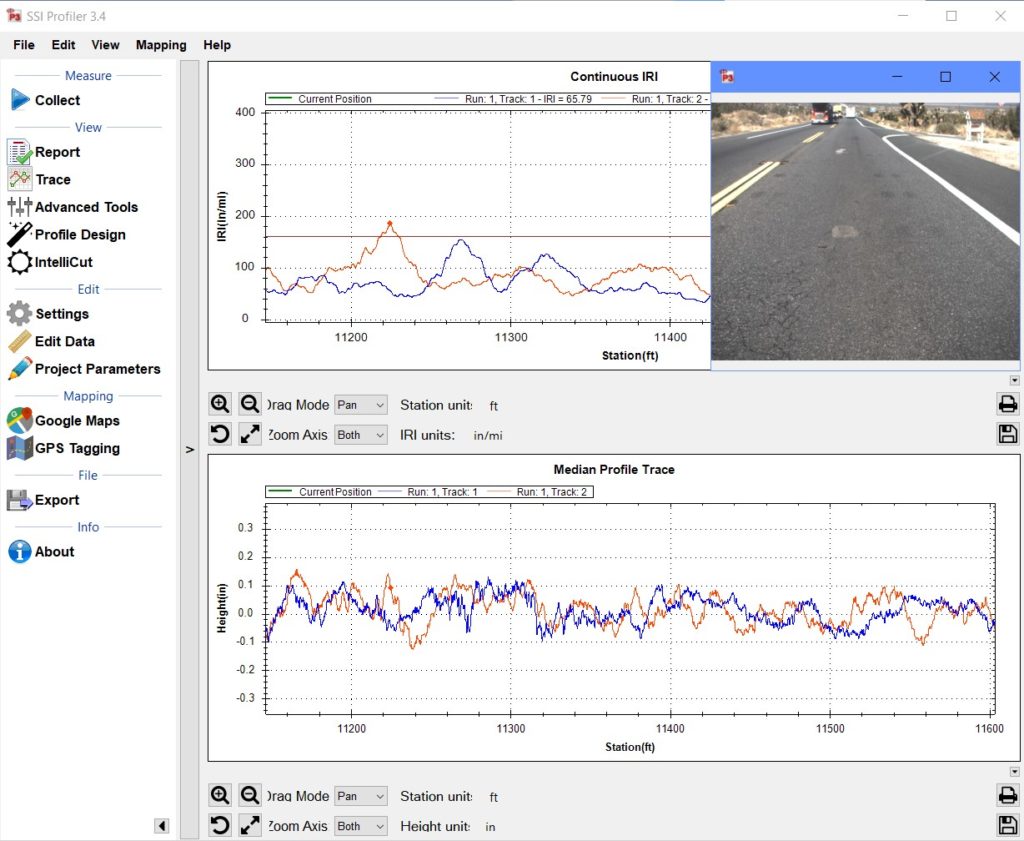
Trace View
The collected data is usually viewed in trace view. This powerful plotter can graph IRI, HRI, MRI, localized roughness, profile, grind locations, and texture by station. It is useful to see the instantaneous changes in profile and how they affect ride within this window.
Trace View also holds the graphing options for grind locations created in ProVal or SSI’s Intellicut. Operators can navigate to these shaded grind locations through GPS within inches. This same tool is the basis of most inertial profiler IRI layout and the CS7900 for mills and grinders.
Edit Data
If the collection started in the wrong spot, has the wrong start station, or was supposed to go down station you can adjust the data within the Edit Data window. There are multiple features for specific customers – most likely if someone else needs a feature, SSI already has it.
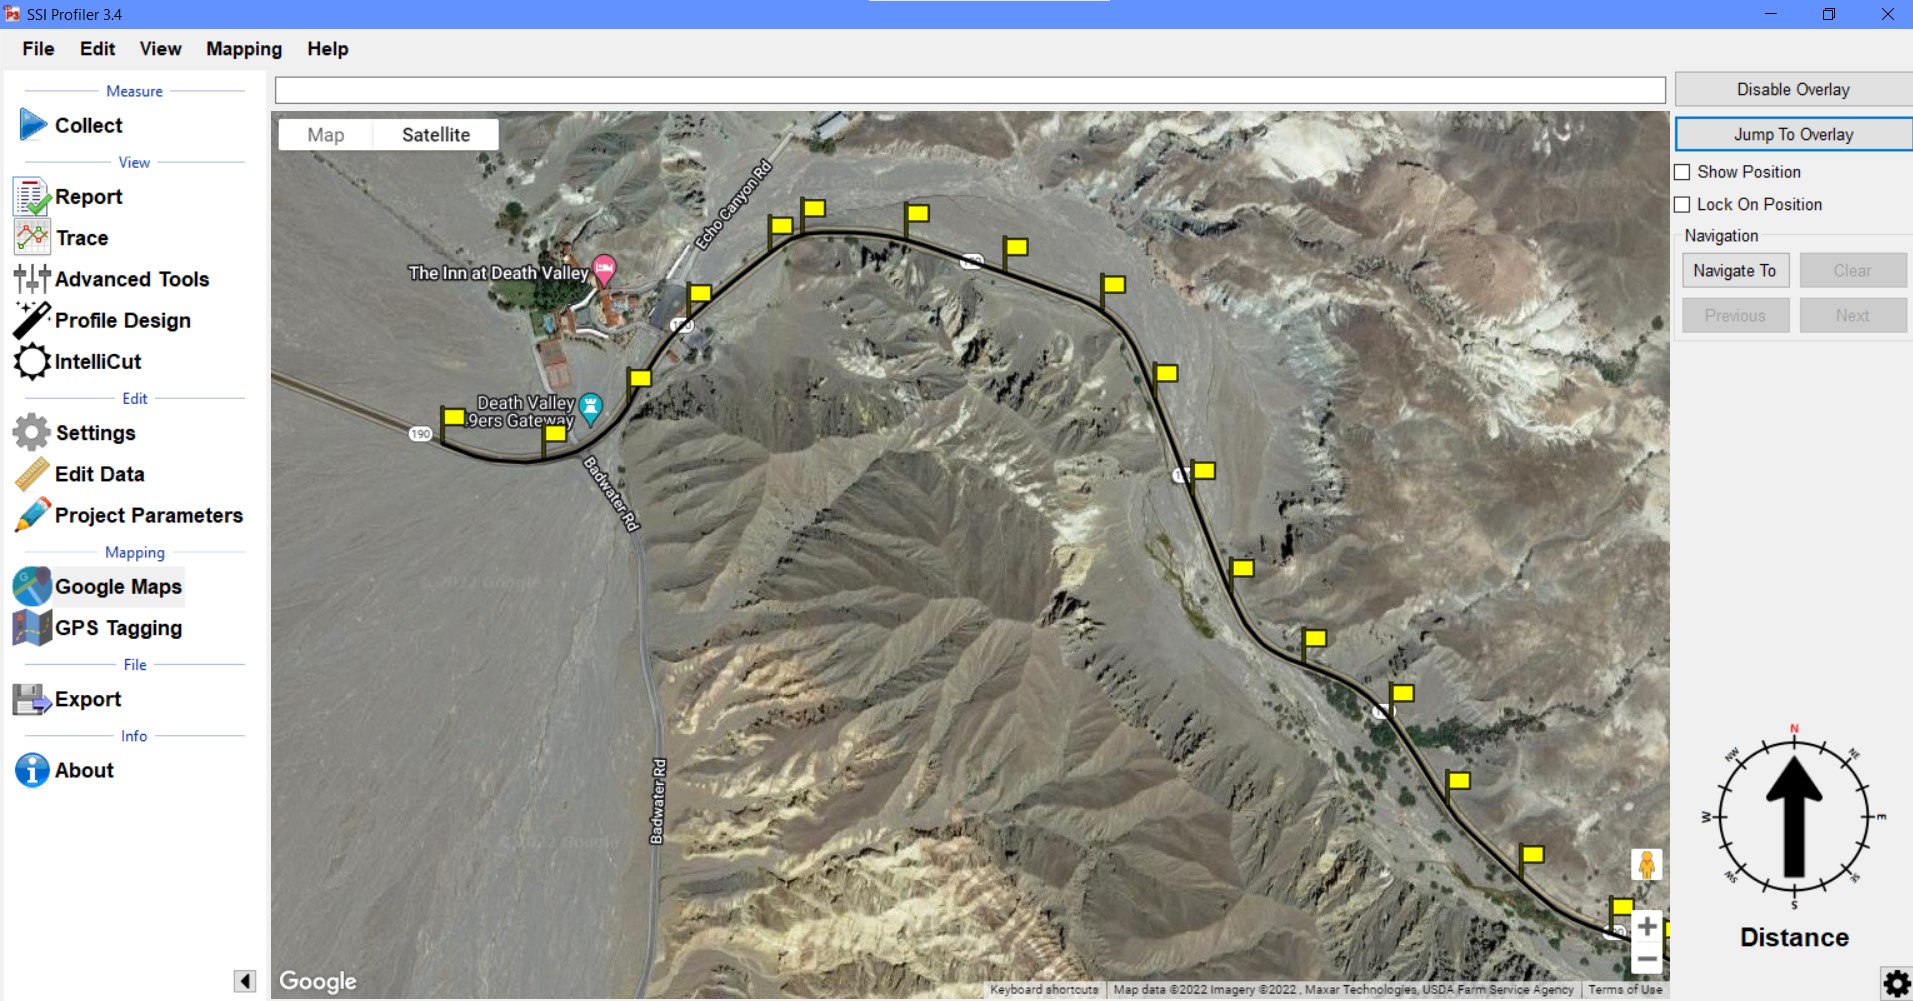
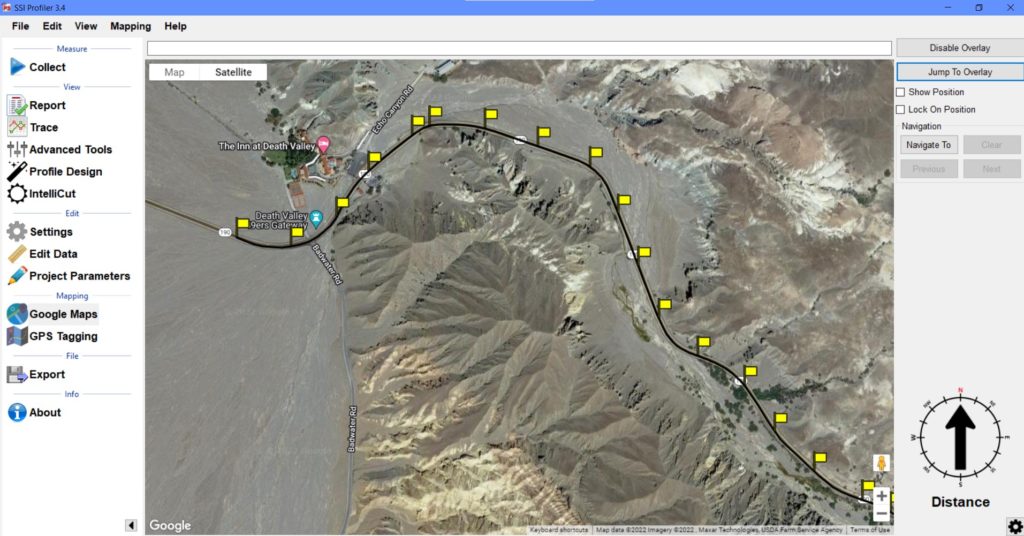
Google Maps
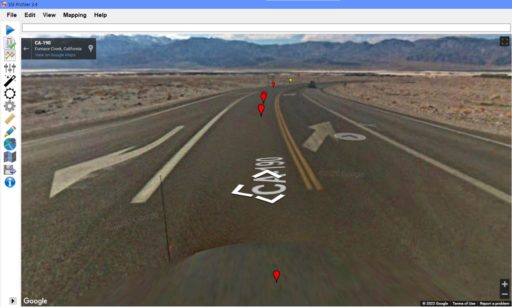
The Google Maps function is preferred by most users who have an internet connection. Just looking at a 2D profile doesn’t give the whole story. Look at the collection from a birds eye view to see landmarks and causes of roughness.
Google Maps options include reporting pin options for segments, localized roughness, ROW images, cross-slope, texture, exclusions and events. Drop the street view icon on the project and see the street level pin.
Export
Data can be exported immediately to ERD, PRO, PPF, Excel, GIS, and Google Earth KML/KMZ for all systems. Specialty systems also have texture, survey elevations, and sidewalk exports.
SSI has multiple Excel templates for states DOTs or 3rd party software for pavement management. Contact us for more details on the pavement condition index options.
Report
Through the Report window the data can be printed to PDF or a local printer. Multiple options for reports exist within the software including the traditional continuous trace and summary reports. Most PDF reports are also available in Excel or CSV.
Usually the report window is used by operators to get an immediate summary of the current ride values before exporting to the necessary DOT or agency format.
- Use Trace View to view current GPS position and lay out roughness
- Plot texture, ride values, cross-slope, running grade, histograms and K-values by stationing.
- Edit any data set to correct operator errors
- Fix station direction, start station, and start/end location
- Show project data on user-defined Google Maps within SSI Profiler program
- Move through street view in Google Maps
- Export data for ERD, PRO, PPF, Excel, GIS, and Google Earth KML/KMZ for all SSI systems
- Report data in PDF or hardcopy through Report window
Overview
Advanced Tools is where high volume data streams like images or transverse profiles can be viewed. It is a module that is license activated at the time of system purchase.
Image Viewer
The Right-of-Way (ROW) cameras supplied by SSI can feed images into the software, indexed by stationing. The Advanced Tools Image Viewer allows operators to play the run back as a slideshow. Each row in the Image Viewer is a collected image that can have multiple data fields associated with it.
The table in the Image Viewer can contain multiple fields such as: stationing the image was captured at, instantaneous speed, segment ride value (IRI, PRI), number of defects in the segment, instantaneous cross-slope, texture (MPD, ETD, RMS) and rutting (average, maximum).
The image viewer is a recommended tool to illustrate the condition of the project in meetings or after paving is complete. The images give extra information when the 2D profile doesn’t tell the entire story.
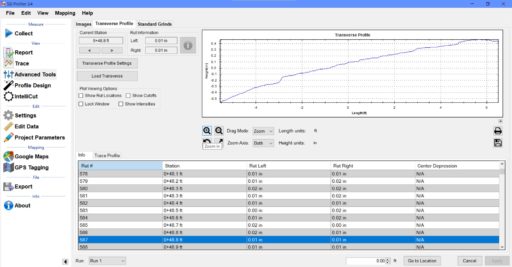
Transverse Profile and Rutting Viewer
Transverse profiles are collected using the CS9500 Full Lane Profiler or CS9300 5-point rutting system. The data sets are large and contain hundreds of thousands or millions of points. The points are plotted within the Transverse Profile Viewer under Advanced Tools. Each row of the table is another transverse profile. The table can display the rut right, rut left and center depression for each sample collected.
The data may be collected at a user specified interval. Usually this is 2-inches longitudinally. However, the CS9500 can collect data down to a 5mm x 5mm grid.
Corrective Grind Sections Editor
If the grind locations were created within ProVal, operators can import them into the SSI Profiler program. After they are imported operators can use Trace View and their connected GPS receiver to navigate to grind locations.
This is one option for the CS7800 Real Time GPS Tool, however the SSI Intellicut software can create grind plans in a fraction of the time. Intellicut creates corrective grind plans automatically based on the project thresholds.
- View ROW images in an office or meeting, away from the project site
- Each ROW image is tied to a station and GPS coordinate
- Create PDF image reports for your records
- Transverse Profile Viewer allows the graphing and calculation of rut depths at each transverse sample location
- Typical transverse sampling is 2-inches longitudinal and 0.5-inch transverse at highway speeds
- If SSI’s Intellicut license is not active, import manual ProVal grind locations from the ProVal SAM module.
Overview
Intellicut is the response to operators spending hours creating manual corrective grind plans. In certain states with zero-tolerance localized roughness, PRI, or MRI specifications Intellicut has saved operators time and effort. What may have taken 1 hour per lane mile now takes minutes.
Issues With Old Manual Grind Plans
If you have used other options for grind plans you may have noticed that other programs:
- May not grind where the roughness is
- Only references short continuous IRI roughness, not fixed interval
- It may overgrind or grind in locations that do not need corrections
- It will not recheck compliance after grinding
- Cannot add more grinds to the plan
- Does not report the grind depth for each location
- Only models Diamond Grinders, not milling machines
SSI Intellicut’s Solution
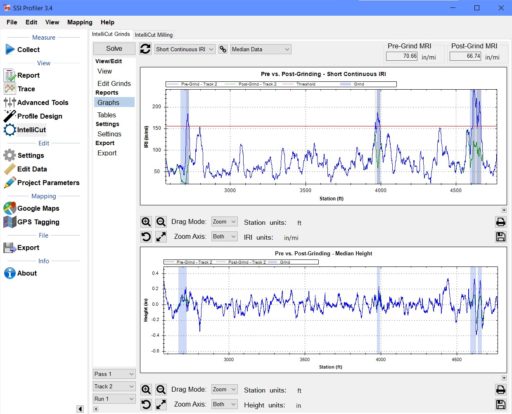
We designed Intellicut to help operators understand the dynamics of the grind process and save time. Intellicut references potential grind locations with the actual out of compliance roughness. The program can create a grind plan and check that the grinds meet the specification. If they do not, the program will add grinds within the tolerances allowed until the location is in compliance.
This iterative process separates Intellicut from other grind simulators. The operator lets the program solve the roughness in the background while completing other tasks.
- Grind for short continuous, long continuous, or fixed interval thresholds (choose one, two, or all three)
- Choose from a pre-defined list of actual grinder models
- Solve both tracks at the same time, with independent results
- Optimize the grinds by minimum length, minimum separation between
- Exclude short segments
- Add more passes
- Block deep grinds from being enabled
- See before and after results in tables and graphs
- Print report to PDF
- Save the grind locations to the data file and layout the grind locations with the GPS Navigation feature in SSI Profiler Trace View
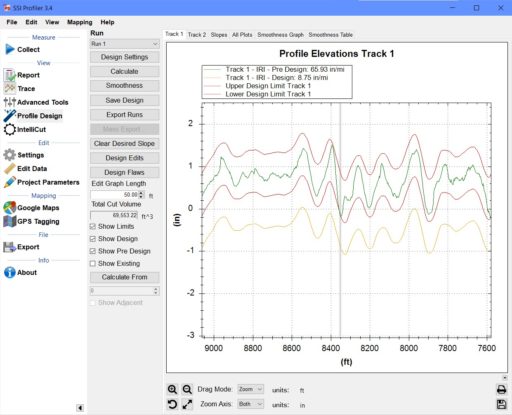
Overview
Profile Design uses the profiles collected by an SSI inertial profiler or survey scanner to smooth out the pavement profile. The program also considers existing cross-slope which the operator can hold value or let the smoothing adjust it as necessary.
The elevation data can be exported a relative height format to be used in a sonic-based 2D+ differential machine control system or exported as survey elevations for true 3D machine control (using a total stations).
Model Profiles To Improve Smoothness
Profile Design has its uses for machine control or variable depth milling operations. The user can select whether the operation is paving or milling, however more improvement can be made to a surface with a mill rather than a floating screed which takes more travel distance to adjust.
SSI is a smoothness based company so Profile Design has a strong analysis section for IRI smoothness. After processing the data the operators can see a full analysis of short continuous and fixed interval IRI values for the entire length of the profile.
Show Variable Cut/Fill Depths
The most powerful aspect of Profile Design is the variable depth graphing. The program can illustrate if the profiles were smoothed too much. This is shown by plotting the minimum and maximum allowable cut/fill against the existing and post profiles. The user can then adjust the limits to change the processed smoothness.
Profile Design is a module within SSI Profiler or stand-alone software that requires a separate license.
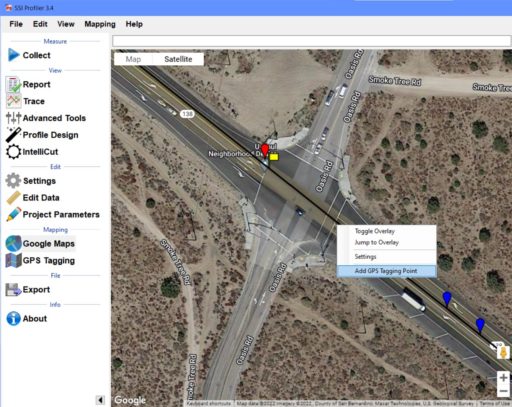
Overview
GPS Tagging is an overall term within the SSI Profiler software for using GPS to add, edit, or trigger collection events. The GPS on SSI profilers have a rated accuracy between 1.5-meters to 4cm. This the “global” survey accuracy – the repeatability of position will be much more consistent and accurate for all receivers.
Create GPS Master Files For Collections
A seasoned system operator is well versed in matching up collections. Now with the GPS Tagging tool the operator can make a master CSV file for a certain lane. This file contains coordinates for the start, end, events, and exclusions within the dataset. The operator can use this master file to trigger collections based on the GPS coordinates with a high accuracy (1-2 feet).
The master file can be created from previously collected data files, known GPS coordinates, or by pre-driving the project.
GPS Tagging to Edit Data Files
Operators can use the GPS coordinates to edit past data files by importing events and exclusions or through the Trace View. The GPS Tagging function in trace view also allows for an operator to append data to existing data files by using the current GPS string of the profiling system.
- Standard on SSI systems
- Collect data without touching the computer
- True single person data collections
- Match previous data file events within 5-feet (1.5 meters)
- Use GPS coordinates or GPS Tagging file to edit data files
- Add events, pauses, or grind locations after collection in case they were missed
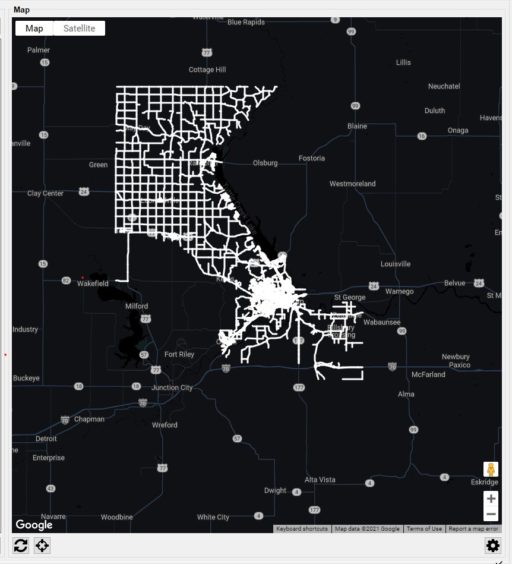
Overview
SSI built the Network Manager for our customers who desired an easier way to integrate into city or county pavement networks. The pavement paths can be imported into SSI Profiler through a shapefile or Google Earth KML. Using the start/end limits of the imported paths the SSI program triggers the collection by GPS.
Determine distress scores from AI-trained models.
Collect and Track Paths By GPS
The Network Manager will group street names together so that multiple paths can be collected in one pass. This can be done automatically or manually by the operator.
As data is collected the imported map displays the collected paths in a different color. The paths that have already been reported are also a different color.
Export Data
The Network Manager can export the data into an Excel or GIS file, separating all paths by their name or segment ID from the original network shapefile. The data exported can include:
- Wheelpath IRI
- Lane MRI
- Rutting
- Cross-slope
- Running Grade
- Texture (MPD,ETD,RMS)
Overview
Validation Engine is the data comparison, troubleshooting, and analysis software developed by SSI. Validation Engine is commonly used for repeatability of different profiles and viewing raw sensor data.
Analyze Different Data Streams
Validation Engine (VE) confirms the repeatability and accuracy of the profiler. VE can verify the elevation profiles, ride values, wavebands and determine the best runs out of a set.
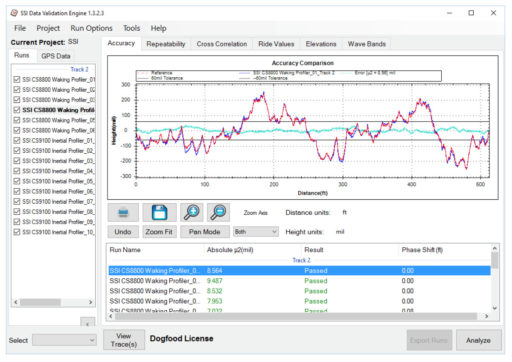
- Import multiple profiles and reference profiles for comparison
- Verify raw sensor data
- Analyze for repeatability and cross-correlation
- Configurable cut-offs for wavebands (IRI, long, medium, short) to compare device performance across wavebands of interest
- Apply global filters and edit profile data
- Visualization of GPS content and quality throughout profile data files